
Bad Ideas Designed To Stop People Thriving: #1, The Learning Curve
Think about developing a skill, and you think of a learning curve. Early on you improve quickly, then progress gets slower; and it’s soon hard to tell if you’re improving at all. At some stage you plateau and stop improving, just like your handwriting, driving and party dancing did a few decades ago. If you’re super conscientious you practice for 10,000 hours, making tiny improvements to get really good, but this seems to have a high price. Here’s how that learning curve looks
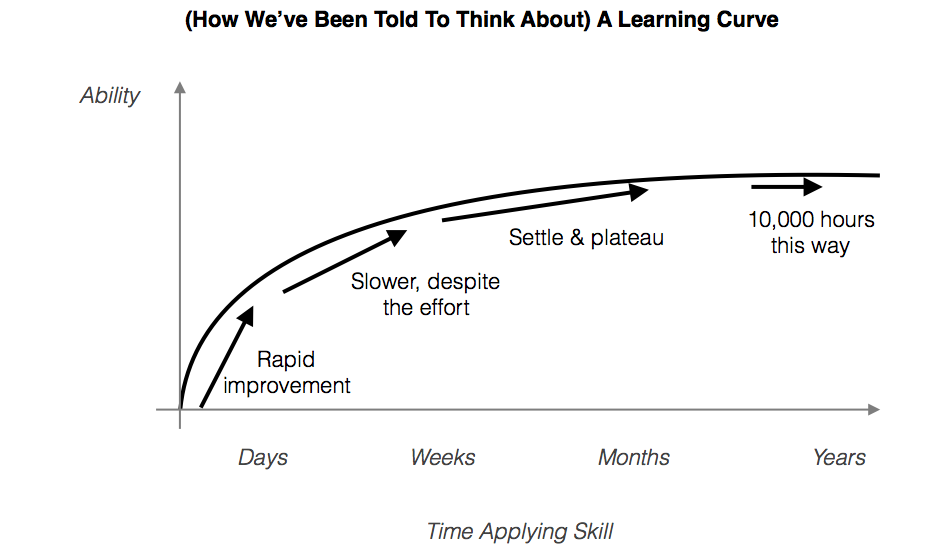
If we think like this, it’s no wonder that we eventually stop making an effort to get better and unconsciously start coasting, then maybe even start looking around for a new skill.
The good news is that this limiting picture of learning curves is, in the vernacular, “a crock of shit”:
- Learning curves for individuals don’t need to look like this – there’s nothing inevitable about plateauing
- The vertical axis measures the wrong thing, and fools us into thinking the wrong way
I’ll just look at this second issue here, and propose a better measure that will make you think differently and cheer you up.
What if we looked at reward instead of ability?
Let’s analyse the data lover’s paradise of baseball, and the abilities of folk who are all the way along baseball’s learning curve – starting pitchers for major league teams.
Here’s the pitching ability of the top 55 ranked pitchers using one common measure: walks and hits per innings pitched, or WHIP. Lower is better.
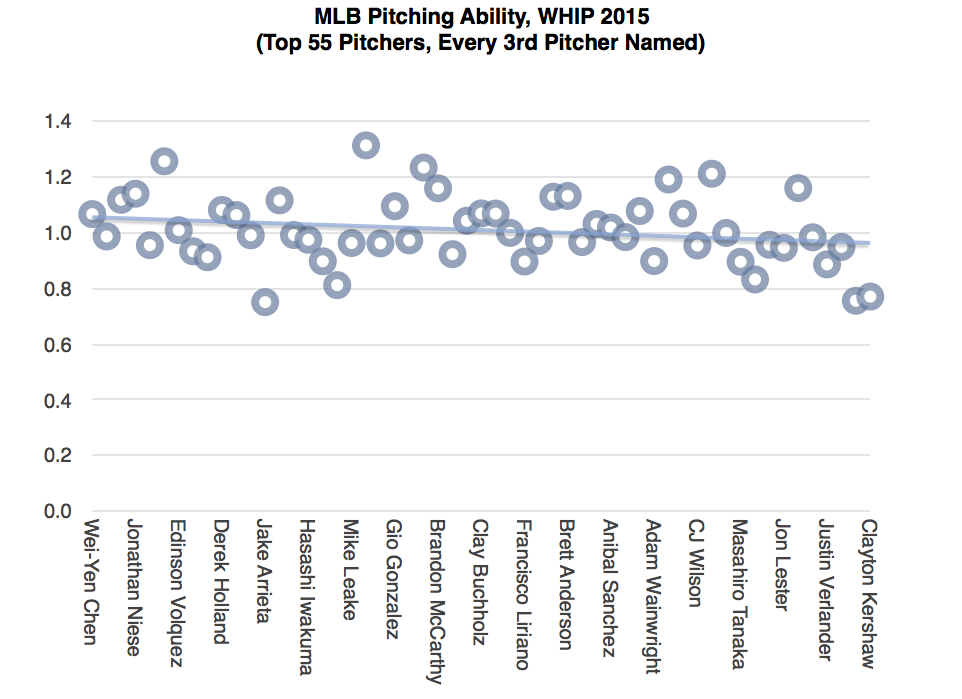
I’ve only shown one season, so variability is higher than for career stats. But if you look at the trend line, you can see the difference in ability between pitcher number 55, Wei-Yen Chen, and pitcher number 1, Clayton Kershaw. It’s tiny: less than 1 hit or walk conceded in every 10 innings pitched. To go up 1 place in these rankings, you need to improve your ability by about 0.2%.
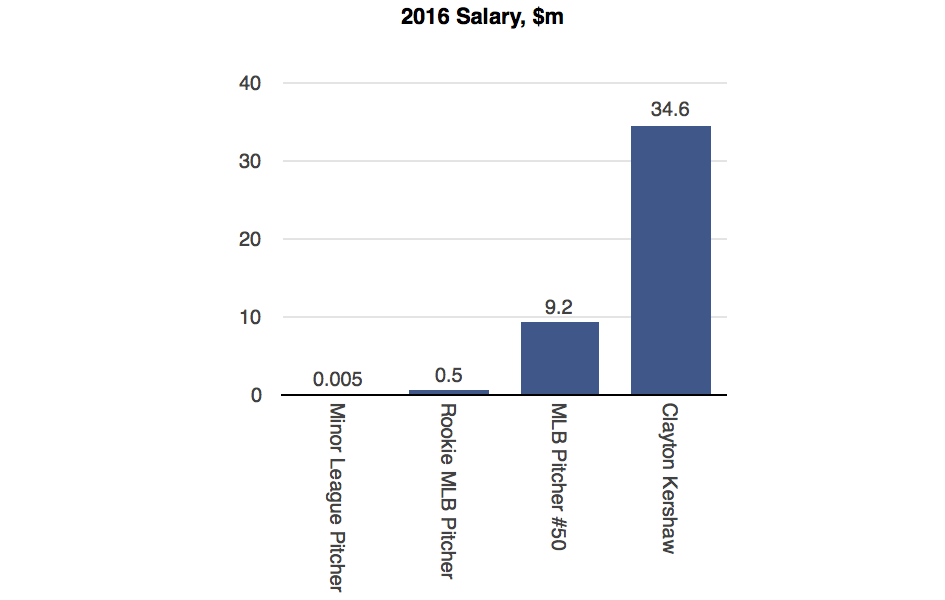
Let’s look again at our pitchers, but instead of comparing ability, we’ll compare how much they get paid.

Don’t forget that these guys are on the far right diminishing returns part of the learning curve. The difference in their abilities is tiny, but the reward for tiny improvement is huge. In fact the further along the learning curve you go, the more difference a tiny improvement makes. Here’s a comparison of salaries that includes people from the full professional spectrum of pitching ability.
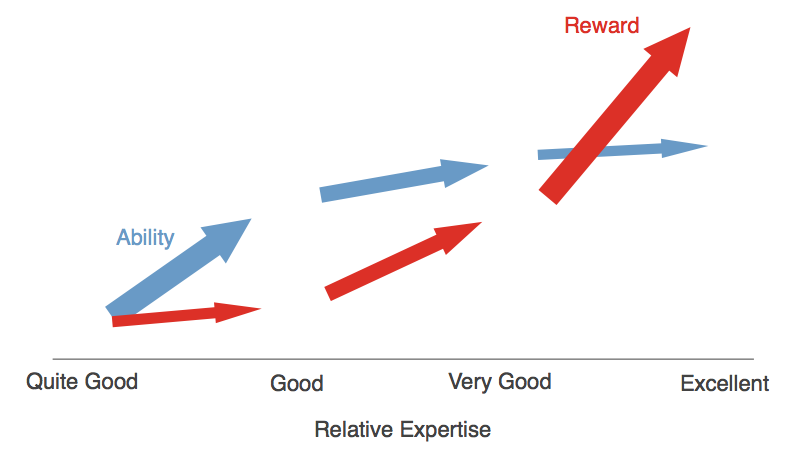
Choose any field that rewards ability – from sales and project management to writing novels and betting on football matches – and you’ll find the same pattern. Change your reward from money to whatever is important to you: glory, gold medals, cats rescued or souls saved from damnation, and again the pattern is the same. The better you get, the bigger your reward for getting even better. Looking only at increase in ability leads us to draw the wrong conclusions because it’s the rewards that really matter. When we look at rewards, we end up seeing our learning curve in a new way:
What to Practise?
Moving from left to right on this chart is about smart, conscious practice. That leads us to 2 questions: what to practise and how to practise?
My takeaway from this article is about what to practise: take the few fundamental skills needed to be good at your job and practise those a lot, no matter how good you already are and no matter how little you think you can improve. That seems to be the best way to reap some giant returns on getting a bit better.
Article by Steve Hacking


